JetBrains Rider
JetBrains Rider is a commercial JetBrains IDE for C++, C# and GDScript that uses the same solution system as Visual Studio.
备注
This documentation is for contributing to the game engine, not for using JetBrains Rider as a C# or GDScript editor. To code C# or GDScript in an external editor, see the C# guide to configure an external editor.
导入项目
小技巧
如果 Visual Studio 已经是你的主要 IDE,那么你可以在 Rider 中使用同一个解决方案文件。Rider 和 Visual Studio 使用相同的解决方案文件格式,所以你可以在两个 IDE 间切换,无需重新构建解决方案文件。切换 IDE 时需要更改调试配置。
If you are starting from the scratch, please follow instructions, specifically:
Install all the dependencies.
Figure out the scons command for compiling to target a specific platform.
Provide scons with additional arguments to request a solution file generation:
Add vsproj=yes dev_build=yes to the scons command
The vsproj parameter signals that you want Visual Studio solution generated.
The dev_build parameter ensures the debug symbols are included, allowing to e.g. step through code using breakpoints.
Open the generated
godot.slnin Rider.
备注
Ensure that the appropriate Solution configuration is selected on the Rider toolbar. It affects resolve of the SDKs, code analysis, build, run, etc.
项目的编译与调试
Rider comes with a built-in debugger that can be used to debug the Godot project. You can launch the debugger by pressing the Debug icon at the top of the screen, this only works for the Project Manager, if you want to debug the editor, you need to configure the debugger first.
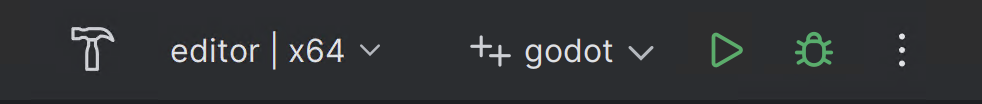
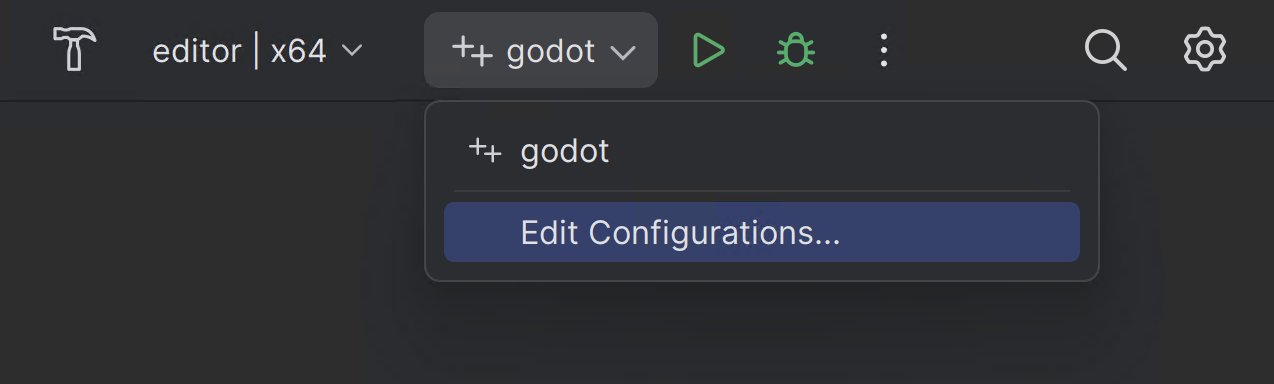
Click on the Godot > Edit Configurations option at the top of the screen.
Ensure the following values for the C++ Project Run Configuration:
Exe Path :
$(LocalDebuggerCommand)Program Arguments:
-e --path <path to the Godot project>Working Directory:
$(LocalDebuggerWorkingDirectory)Before Launch has a value of "Build Project"
This will tell the executable to debug the specified project without opening the Project Manager.
Use the root path to the project folder, not project.godot file path.
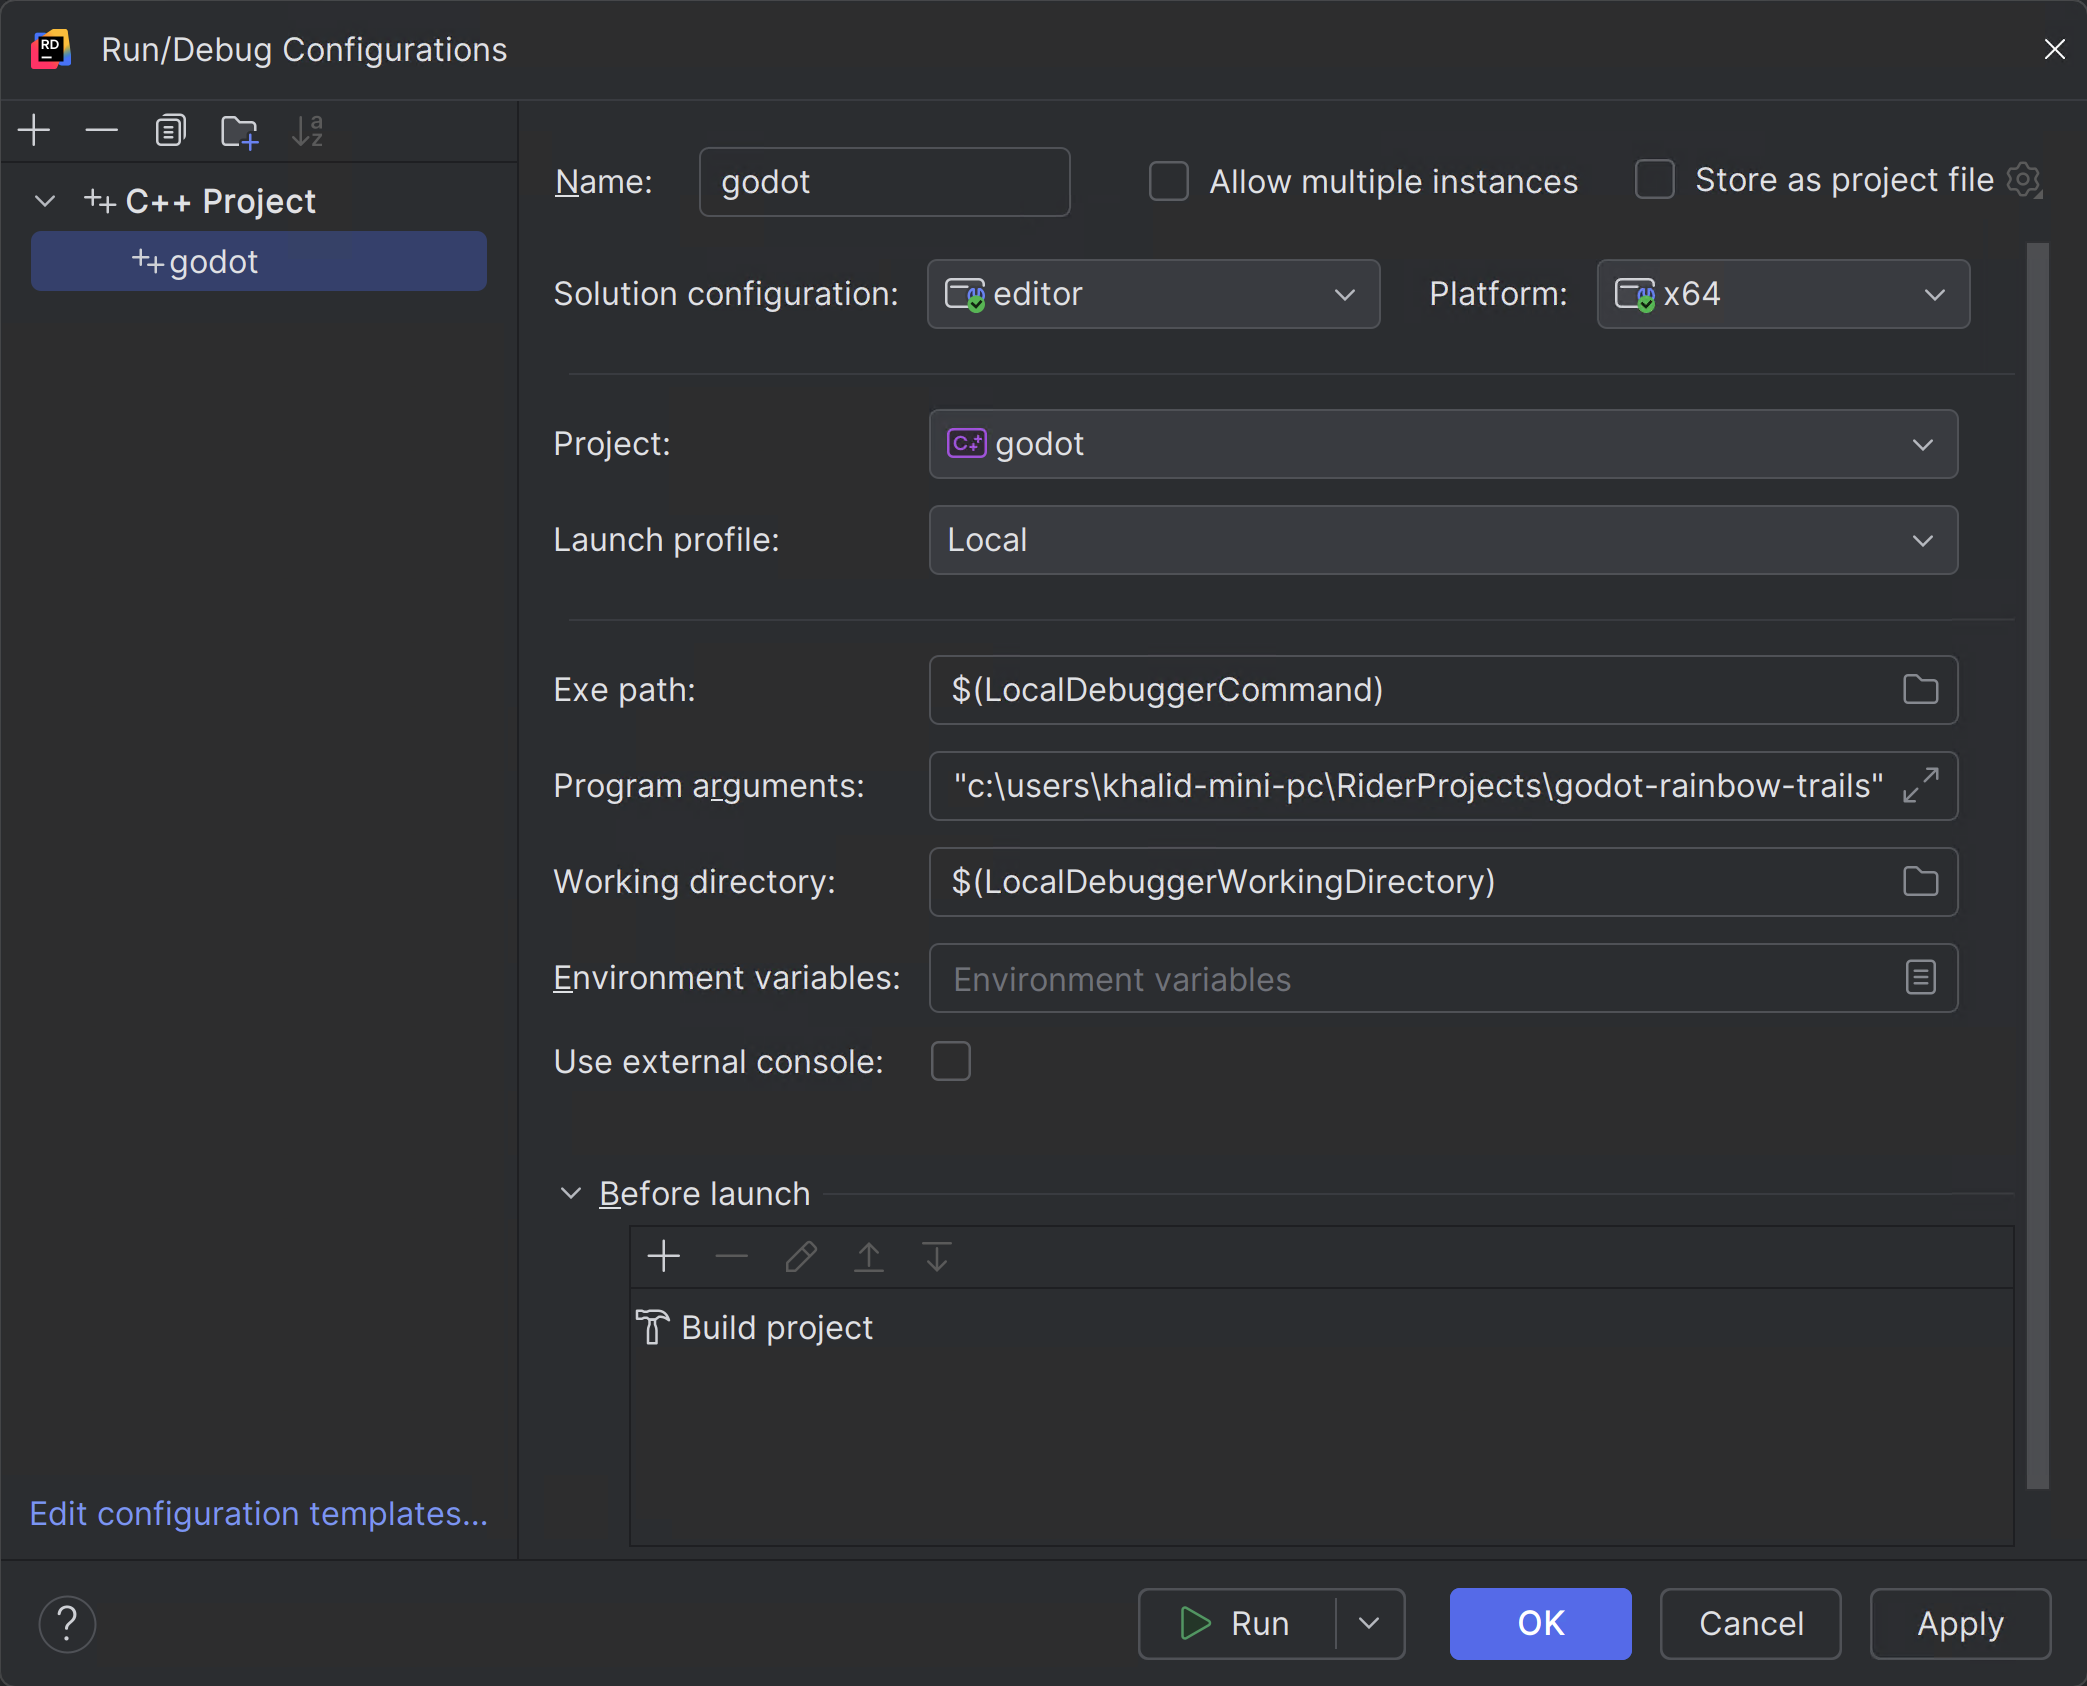
Finally click on "Apply" and "OK" to save the changes.
When you press the Debug icon at the top of the screen, JetBrains Rider will launch the Godot editor with the debugger attached.
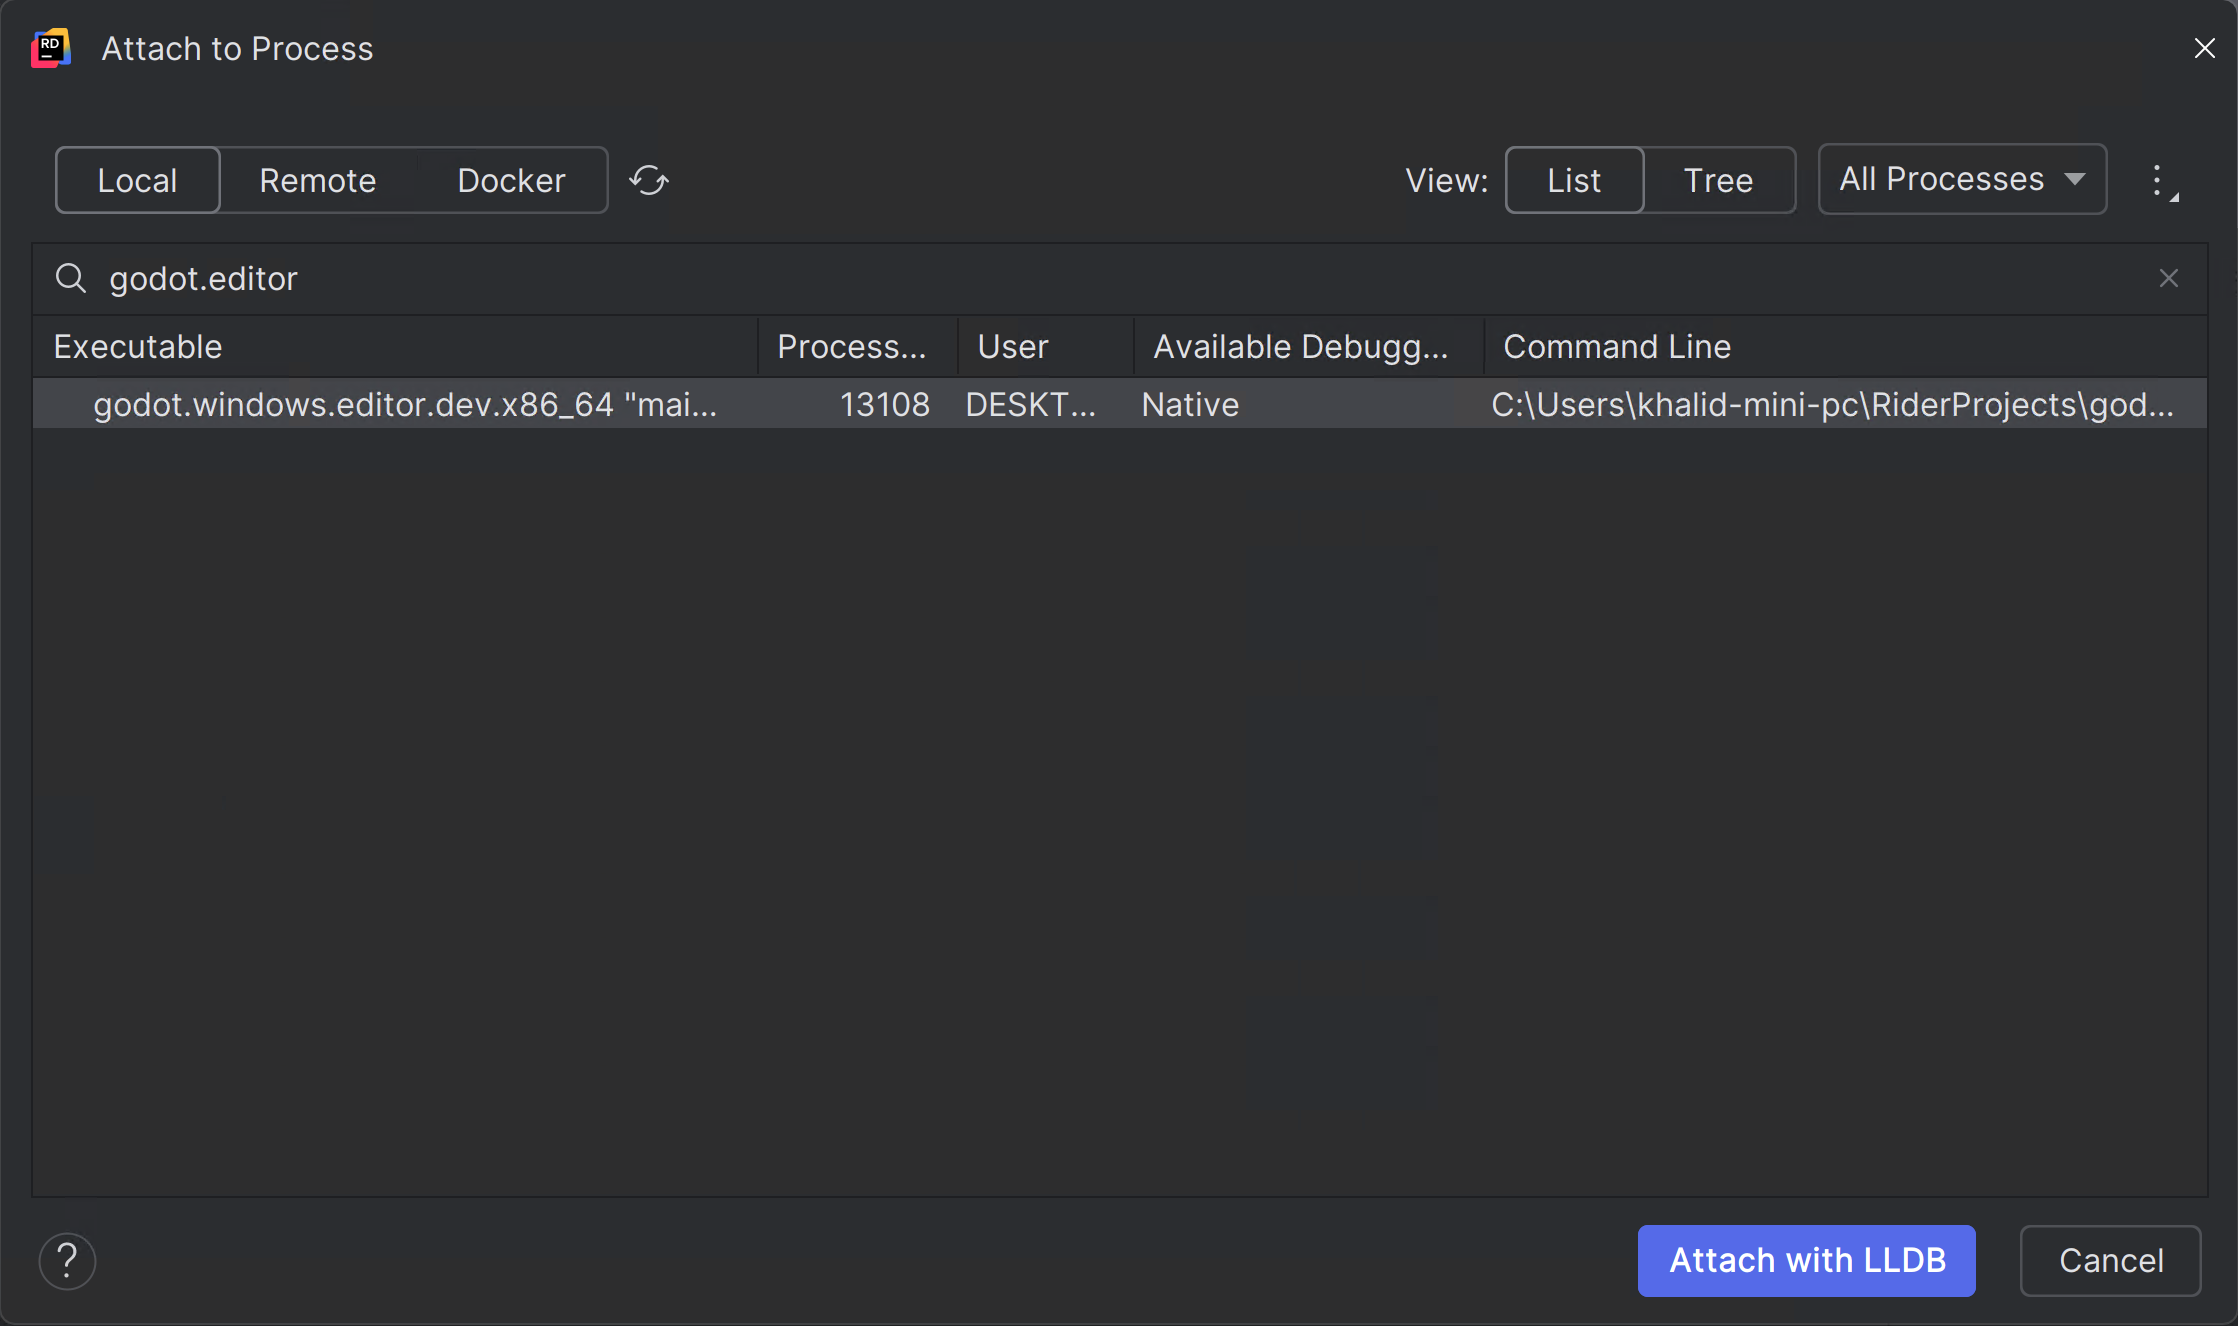
或者,你也可以使用 运行 > 附加到进程 将调试器附加到运行中的 Godot 实例。
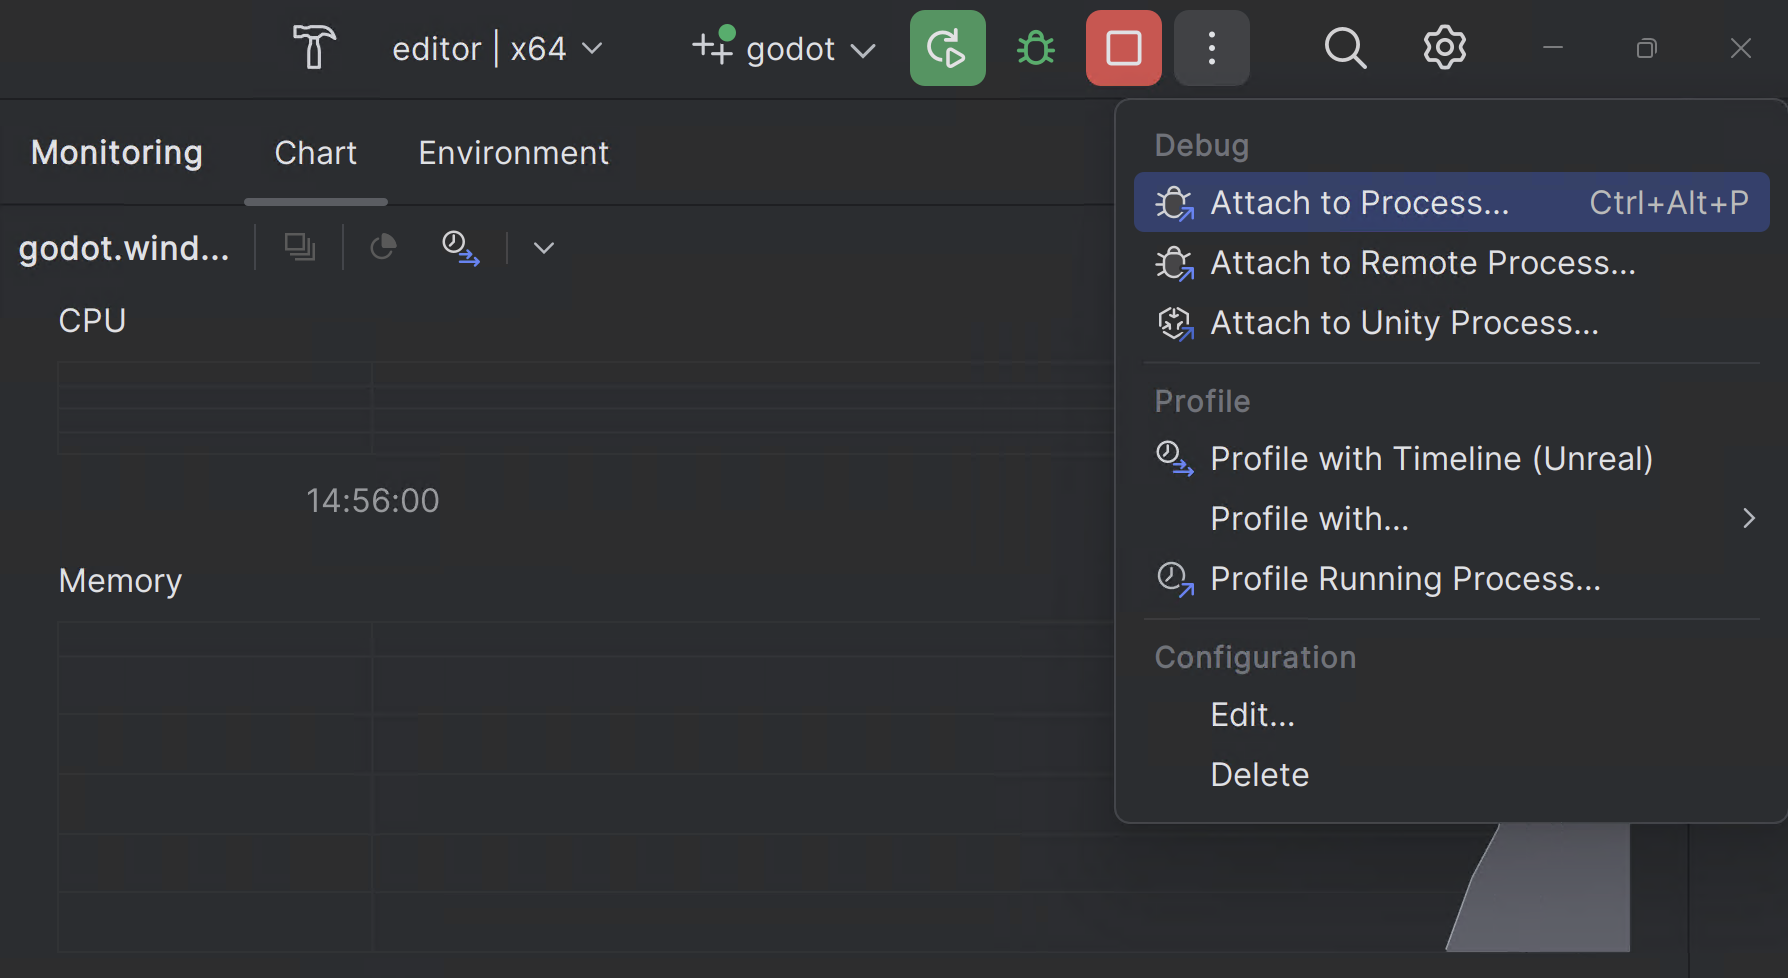
You can find the Godot instance by searching for
godot.editorand then clickingAttach with LLDB
调试观察器
Debug visualizers customize how complex data structures are displayed during debugging. For Windows "natvis" (short for "Native Visualization") built-in with Godot are automatically used. For other operating systems, similar functionality can be setup manually.
Please follow RIDER-123535.
单元测试
Leverage Rider doctest support. Please refer to the instructions.
性能分析
Please refer to the profiling instructions.
Please consult the JetBrains Rider documentation for any specific information about the JetBrains IDE.
已知问题
Debugging Windows MinGV build - symbols are not loaded. Reported RIDER-106816.