Instruments
参见
Please see the sampling profiler instructions and the tracing profiler instructions for more information.
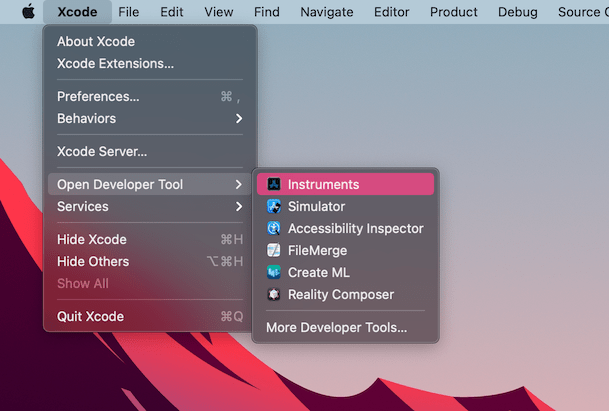
Open Xcode. Select Open Developer Tool - Instruments from the Xcode app menu:
双击 Instruments 窗口中的 Time Profiler :
In the Time Profiler window, click on the Target menu, select Choose target... and specify the path to the Godot binary, command line arguments, and environment variables in the next window.
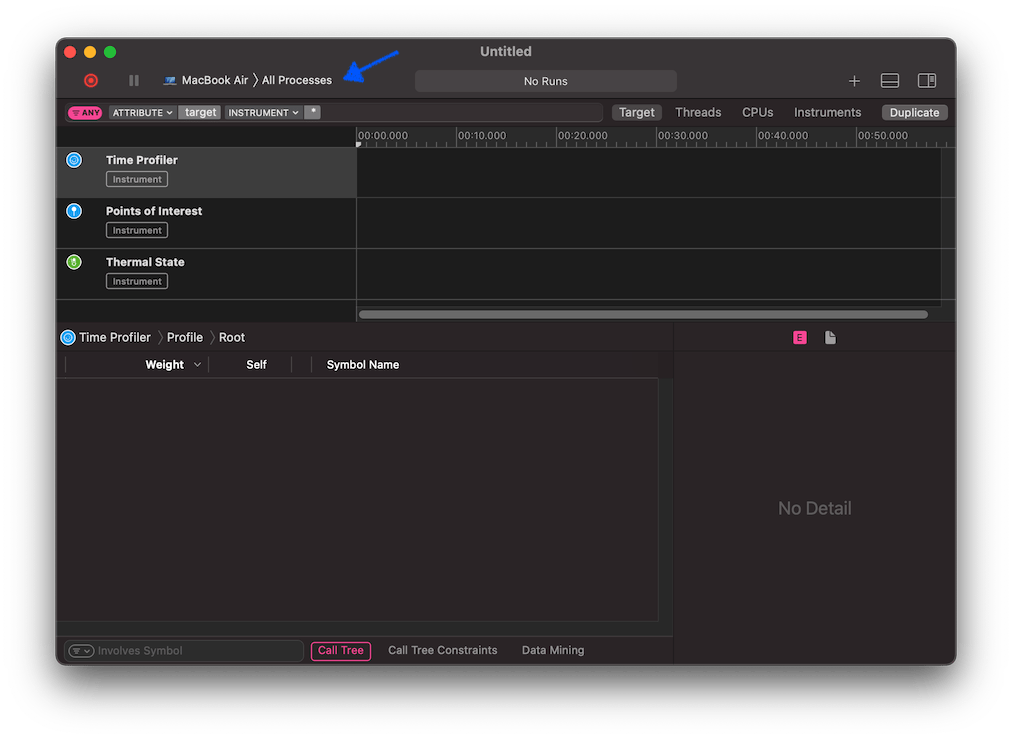
你也可以把 Time Profiler 附加到正在运行的进程上,在 Target 菜单中选择即可。
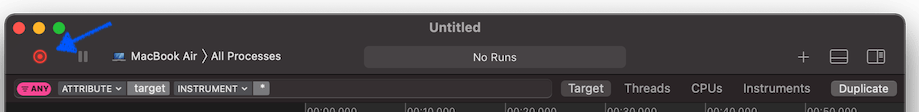
点击 Start an immediate mode recording 按钮开始性能分析。
在编辑器或者项目中执行要分析性能的操作,完成后点击 Stop 按钮。
等待结果出现。
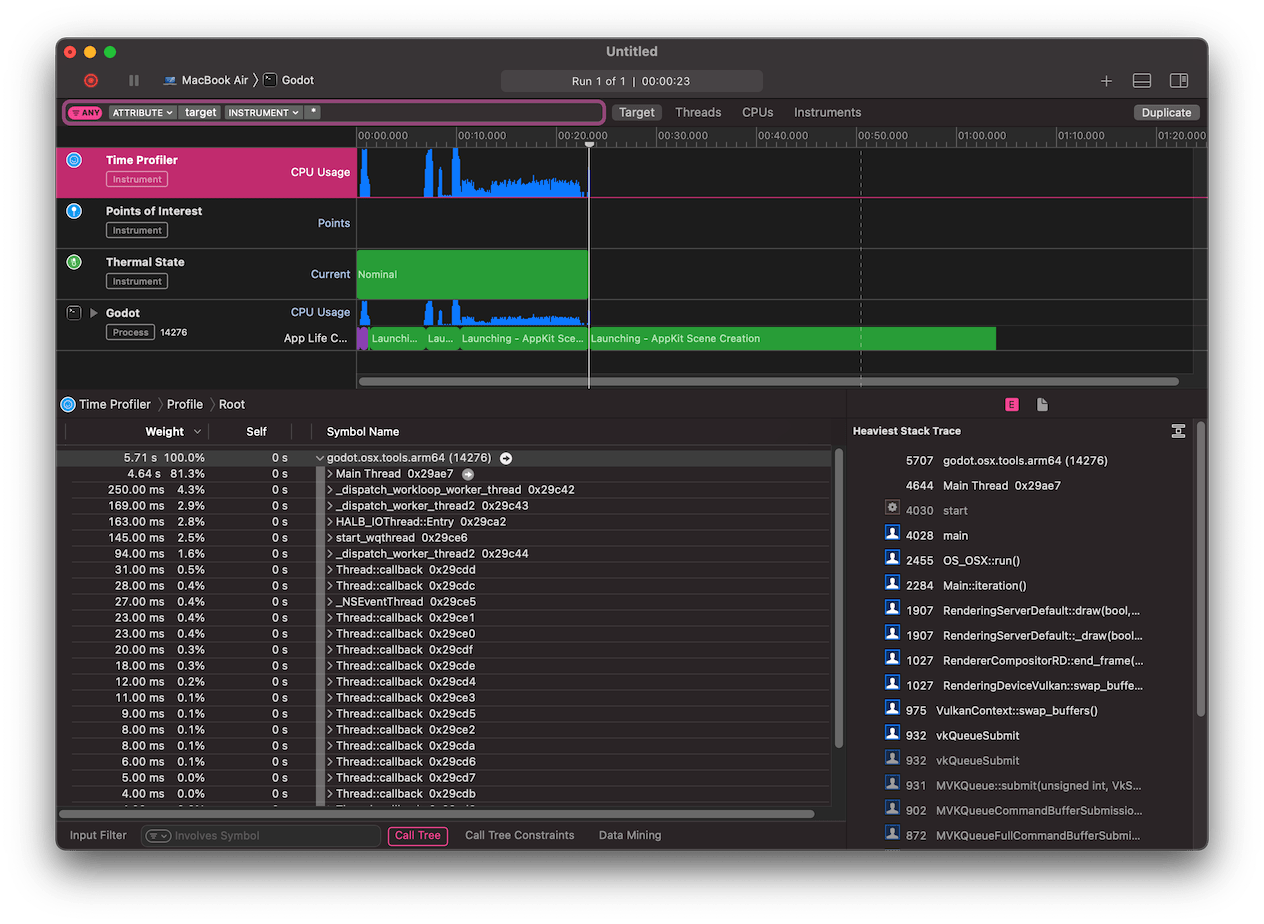
窗口底部会显示所有被启动的 CPU 线程的调用树,以及一个 Heaviest Stack Trace 总览。
Select Hide system libraries in the Call Tree menu (at the bottom of the window) to remove external modules.
你可以使用窗口顶部的时间线来控制只显示特定时间段内的详细信息。