Hotspot
参见
Please see the sampling profiler instructions for more information.
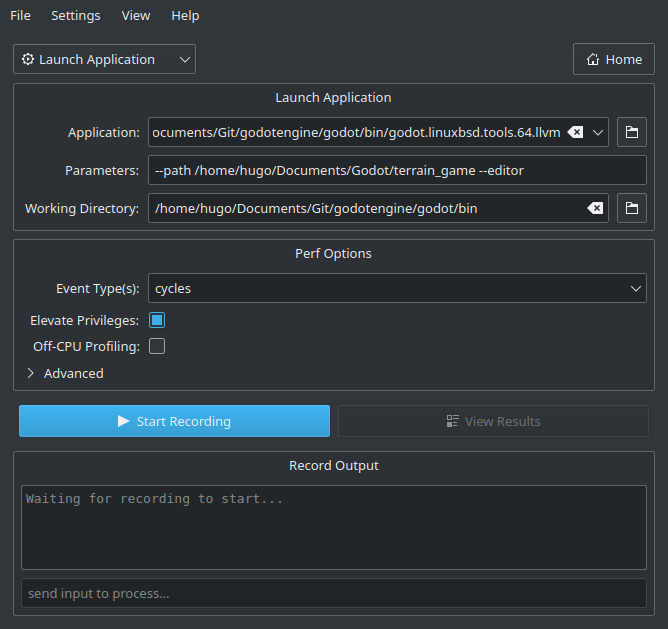
打开 Hotspot 。点击 Record Data :

在下一个窗口中,指定包含调试符号的 Godot 可执行文件的路径。
指定运行项目所使用的命令行参数,用不用编辑器运行都行。
The path to the working directory can be anything if an absolute path is used for the
--pathcommand line argument. Otherwise, it must be set so that the relative path to the project is valid.Make sure Elevate Privileges is checked if you have administrative privileges. While not essential for profiling Godot, this will ensure all events can be captured. Otherwise, some events may be missing from the capture. Your settings should now look something like this:
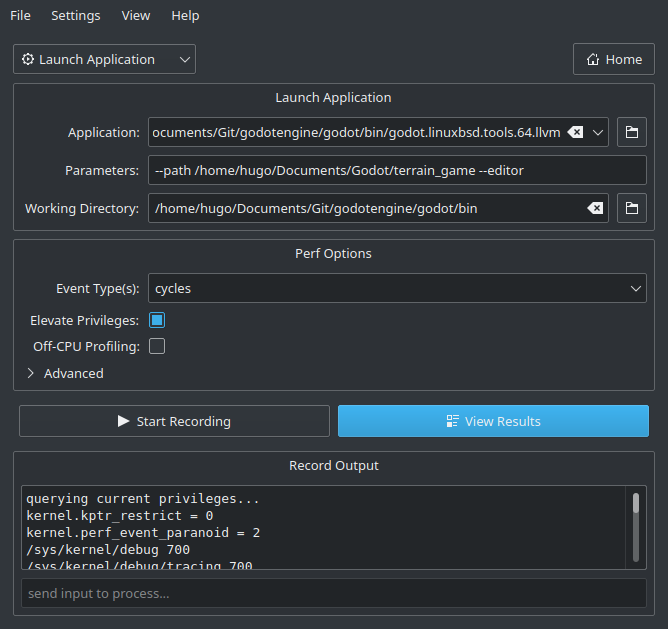
点击 Start Recording 然后在编辑器或者项目中执行需要分析性能的操作。
Quit the editor/project normally or use the Stop Profiling button in Hotspot to stop profiling early. Stopping profiling early can result in cleaner profiles if you're not interested in the engine's shutdown procedure.
点击 View Results 然后等待生成可视化性能分析结果:
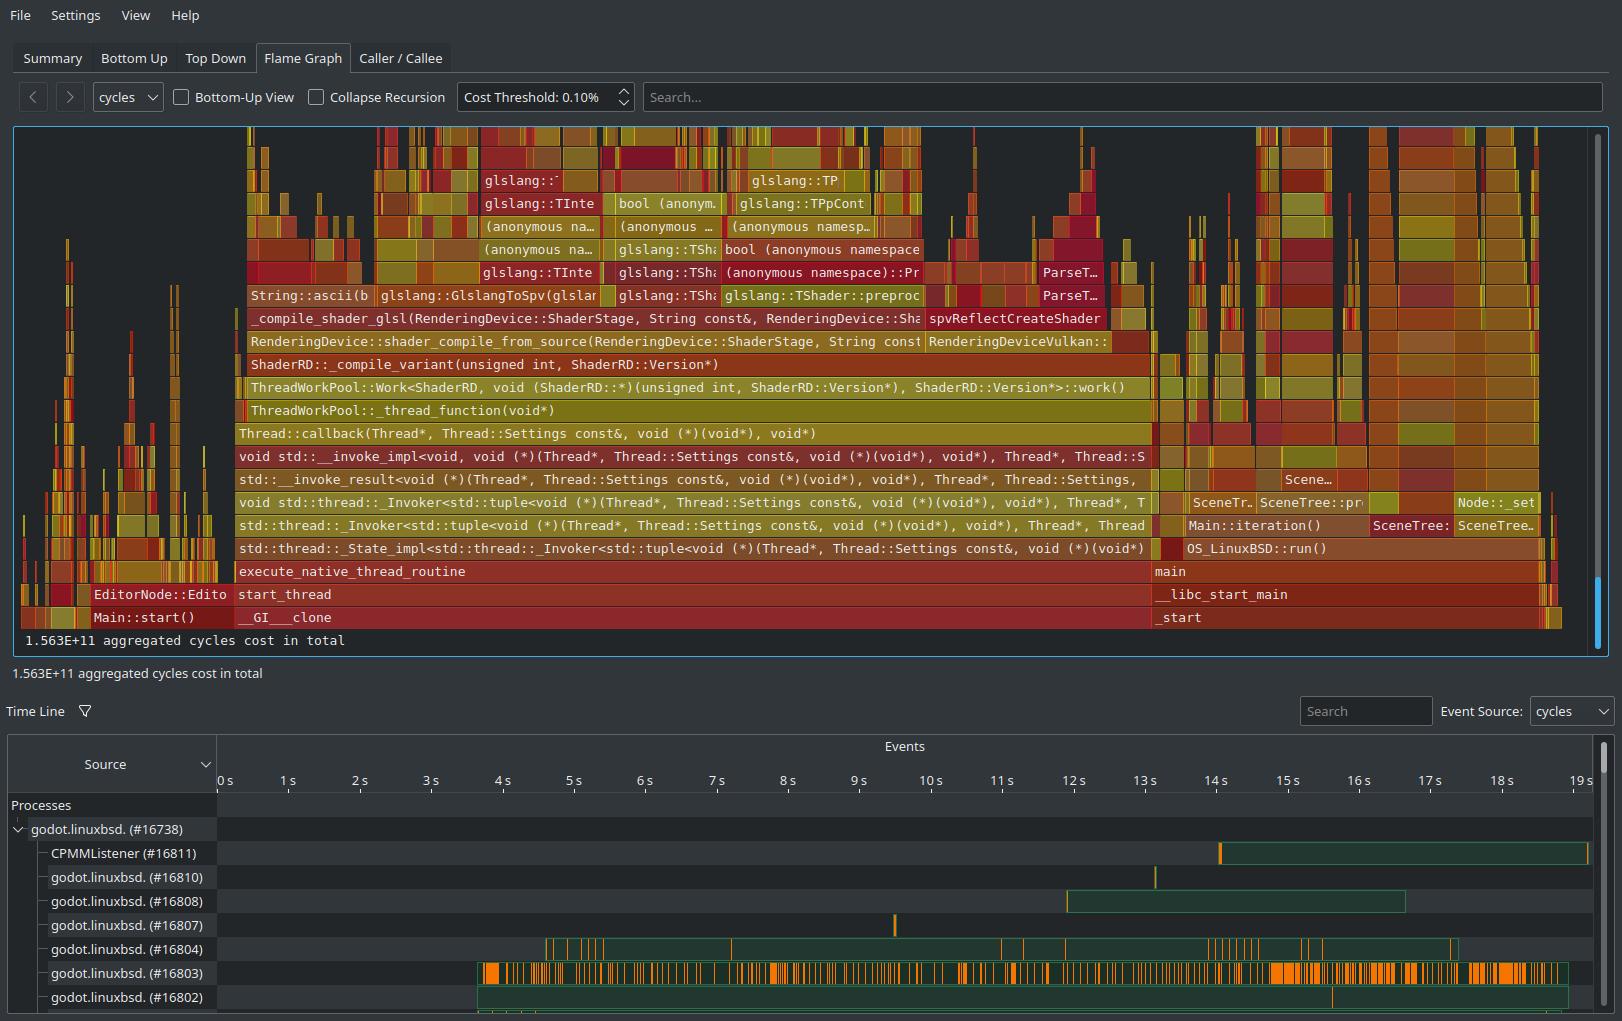
使用顶部的选项卡可以切换不同的视图,这些视图是用不同的方式显示相同的数据。 Flame Graph(火焰图) 选项卡里可以很直观地找到哪些函数占用的时间最长。这些函数就是终点优化对象了,因为优化后可以显著提升性能。
At the bottom of all tabs except Summary, you will also see a list of CPU threads started by the engine along with the CPU utilization for each thread. This lets you see threads that can be a bottleneck at a given point in time.
备注
If you don't want the startup procedure to be included in the profile, you can also attach Hotspot to a running process by clicking Record Data then setting the Launch Application dropdown option to Attach To Process(es).
这样基于附加到进程的工作流和 VerySleepy 比较类似。